chart_typeenumобязательный
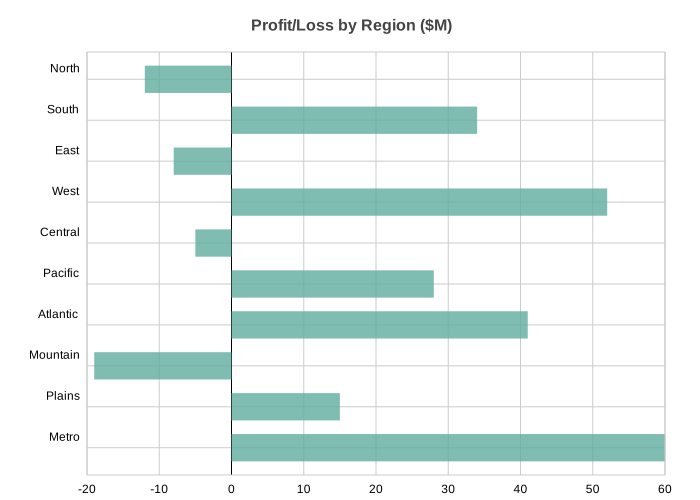
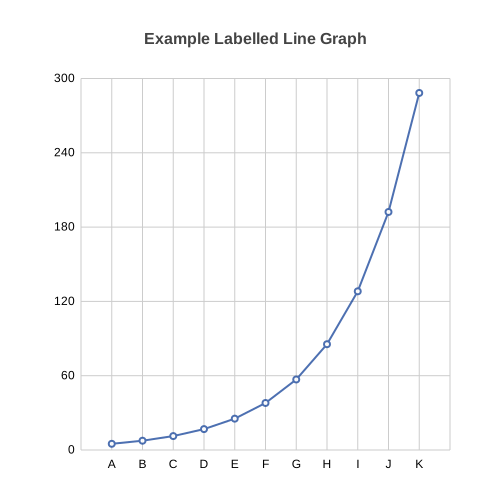
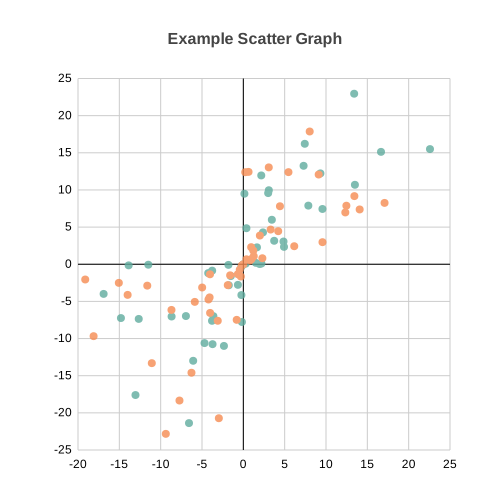
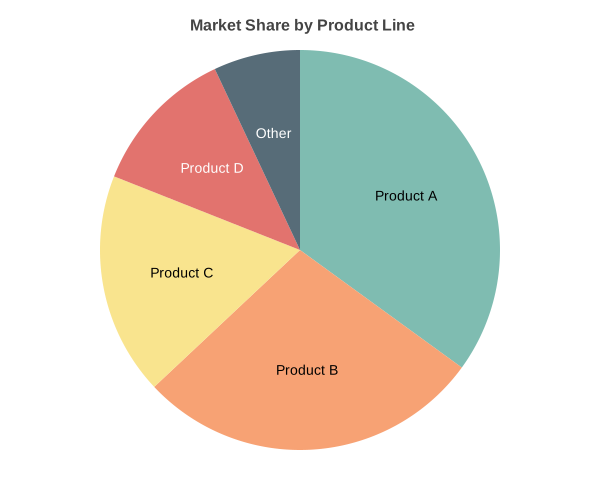
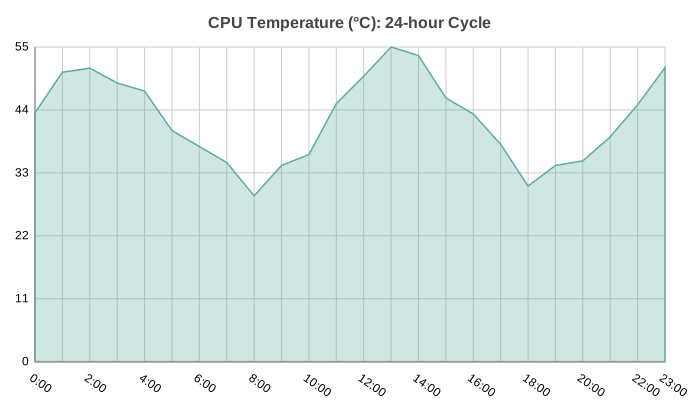
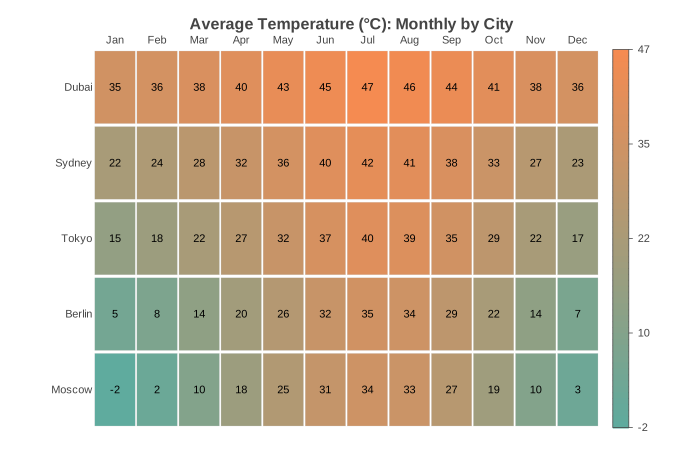
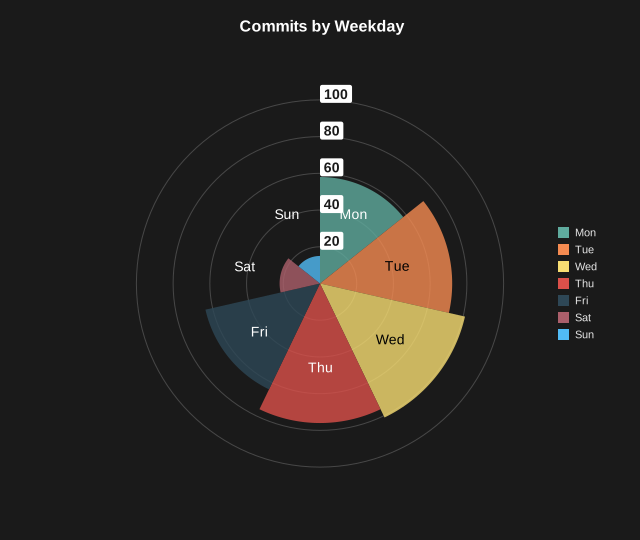
The type of chart to render. 'auto' inspects the data shape and picks the most appropriate type. Examples: 'bar' for horizontal category comparison, 'line' for time-series trends, 'pie' for part-of-whole proportions, 'scatter' for XY correlation, 'heatmap' for a 2-D color matrix.
dataarray | objectобязательный
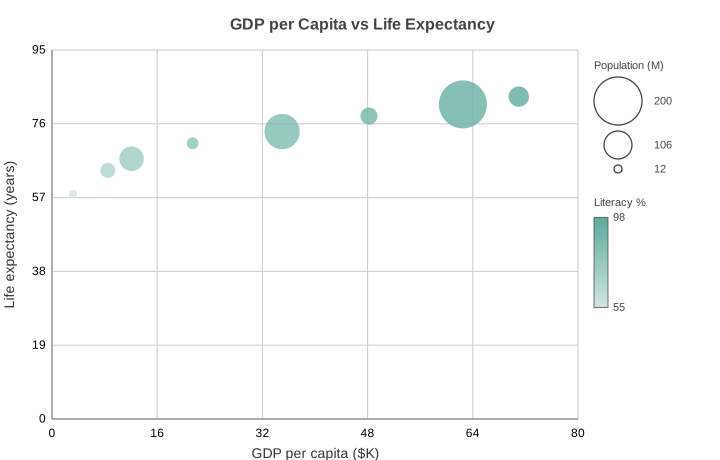
Chart data. For a single series pass a 1-D list of numbers, e.g. [10, 20, 15]. For multiple series pass a 2-D list where each inner list is one series, e.g. [[10, 20], [5, 30]]. Scatter/bubble charts expect [[x_values], [y_values]].
heightnumber
Chart canvas height in pixels. Default is 500. Adjust to control aspect ratio.
labelsstring[]
Category labels for the x-axis, one per data point. Example: ['Jan', 'Feb', 'Mar']. Omit for numeric or auto-indexed axes.
output_formatenum
Format for the returned chart. 'svg' returns raw SVG markup (default, zero extra dependencies). 'html' wraps the SVG in a minimal HTML page. 'data_url' returns an SVG data URL suitable for use in an img src attribute. 'png' rasterizes the chart to a PNG image (requires charted[png]) and returns it as inline image content visible in chat UIs.
save_pathstring
Optional absolute or relative file path where the chart should also be saved on disk. The file extension should match output_format (e.g. 'chart.svg' or 'chart.png'). The tool still returns the chart content regardless.
scalenumber
Resolution multiplier applied when output_format is 'png'. A value of 2 (default) doubles the pixel dimensions for high-DPI displays. Has no effect for SVG output.
series_namesstring[]
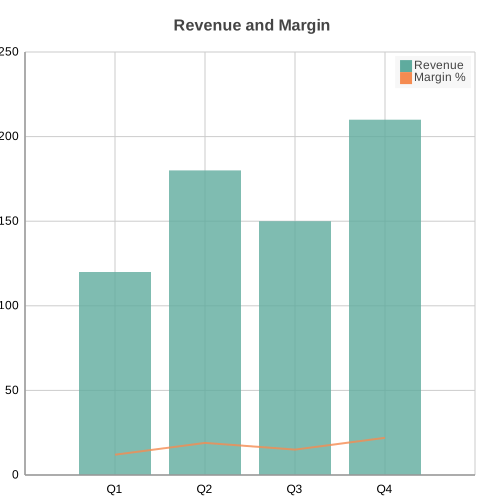
Display names for each data series, shown in the chart legend. Must match the number of series in data. Example: ['Revenue', 'Costs'].
themestring | object
Visual theme. Pass a preset name ('light', 'dark', 'high-contrast') or a palette name ('viridis', 'inferno', 'ocean', etc.) as a string, or a config object such as {'colors': 'viridis', 'background_color': '#1a1a2e'}. Use list_themes to see all available options.
titlestring
Optional chart title rendered above the plot area. Example: 'Monthly Revenue 2024'.
widthnumber
Chart canvas width in pixels. Default is 500. Increase for more detail or wider labels.