






A React data visualization library designed for AI-assisted development.
Simple charts in 5 lines. Network graphs, streaming data, and coordinated dashboards when you need them. Structured schemas and an MCP server so AI coding assistants generate correct chart code on the first try.
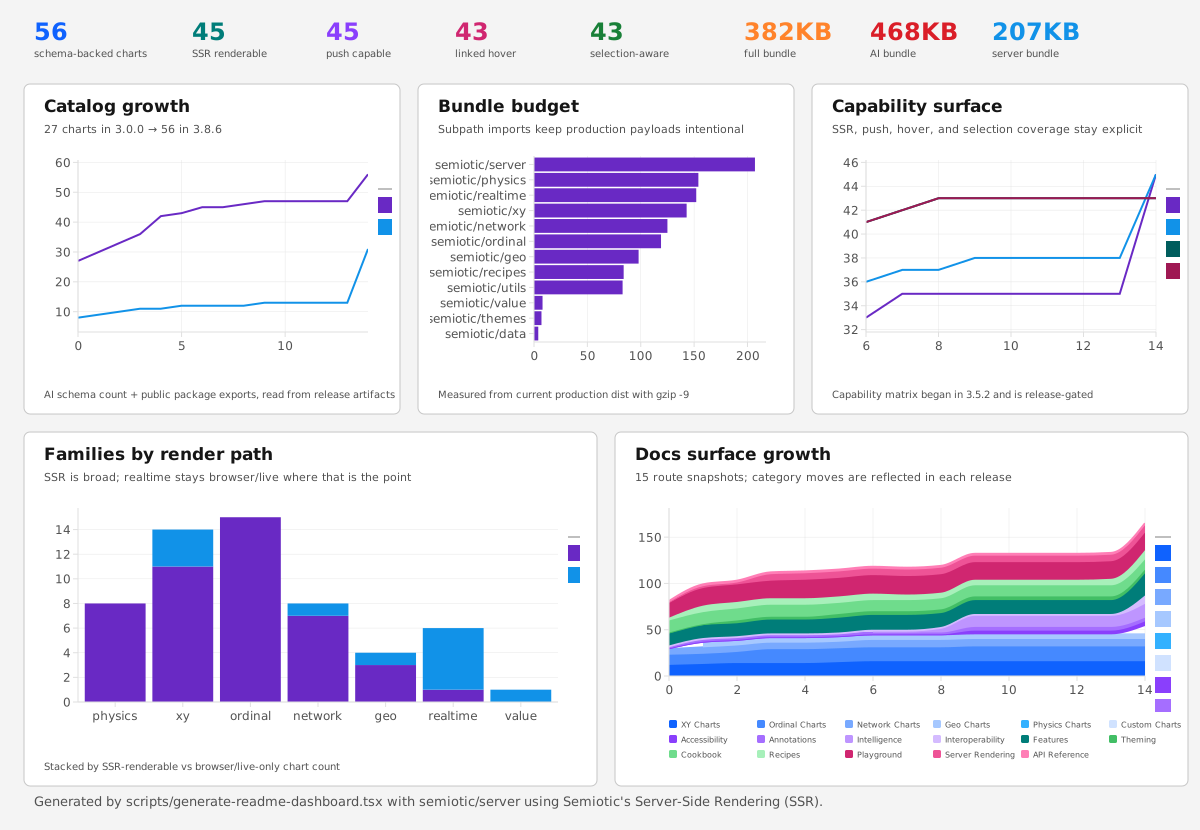
What's New in 3.7.5
3.7.5 is a chart-correctness and responsive-layout patch release:
- ForceDirectedGraph string
edgeWidthaccessors now read the underlying edge data, and server rendering handlesedgeWidth,edgeColor, andedgeOpacityfor SSR parity. - Crowded ordinal category axes now thin tick labels to avoid overlapping temporal-histogram bins.
- XY custom-layout overlays now re-run on responsive size changes, keeping SVG chrome aligned with canvas scene nodes after first measurement.
import { LineChart } from "semiotic/xy"

<LineChart
  data={salesData}
  xAccessor="month"
  yAccessor="revenue"
/>
Why Semiotic
Semiotic is a data visualization library for React that combines broad chart coverage with first-class AI tooling. It handles the chart types that most libraries skip — network graphs, streaming data, statistical distributions, coordinated views — and ships with machine-readable schemas so LLMs can generate correct code without examples.