MCP Dashboards
Your AI can talk about data. Now it can show it.







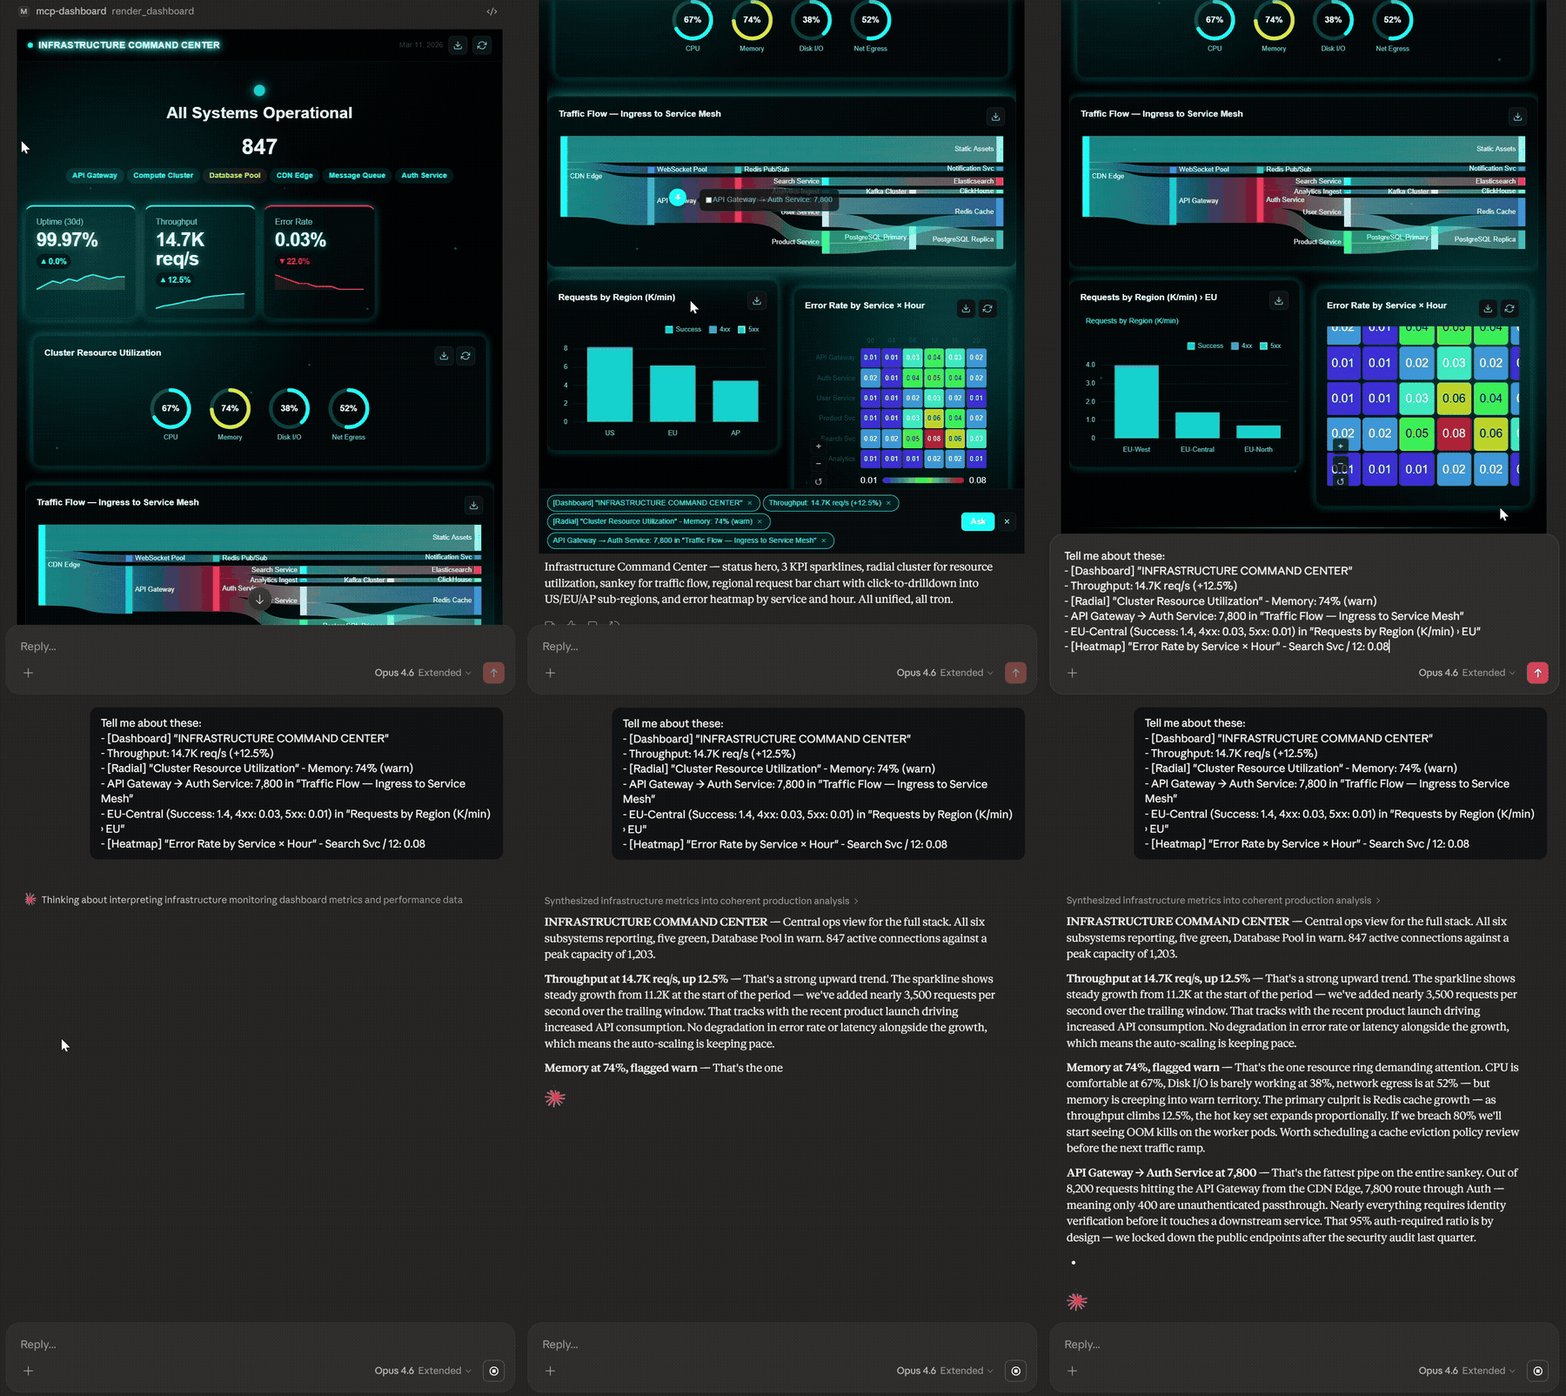
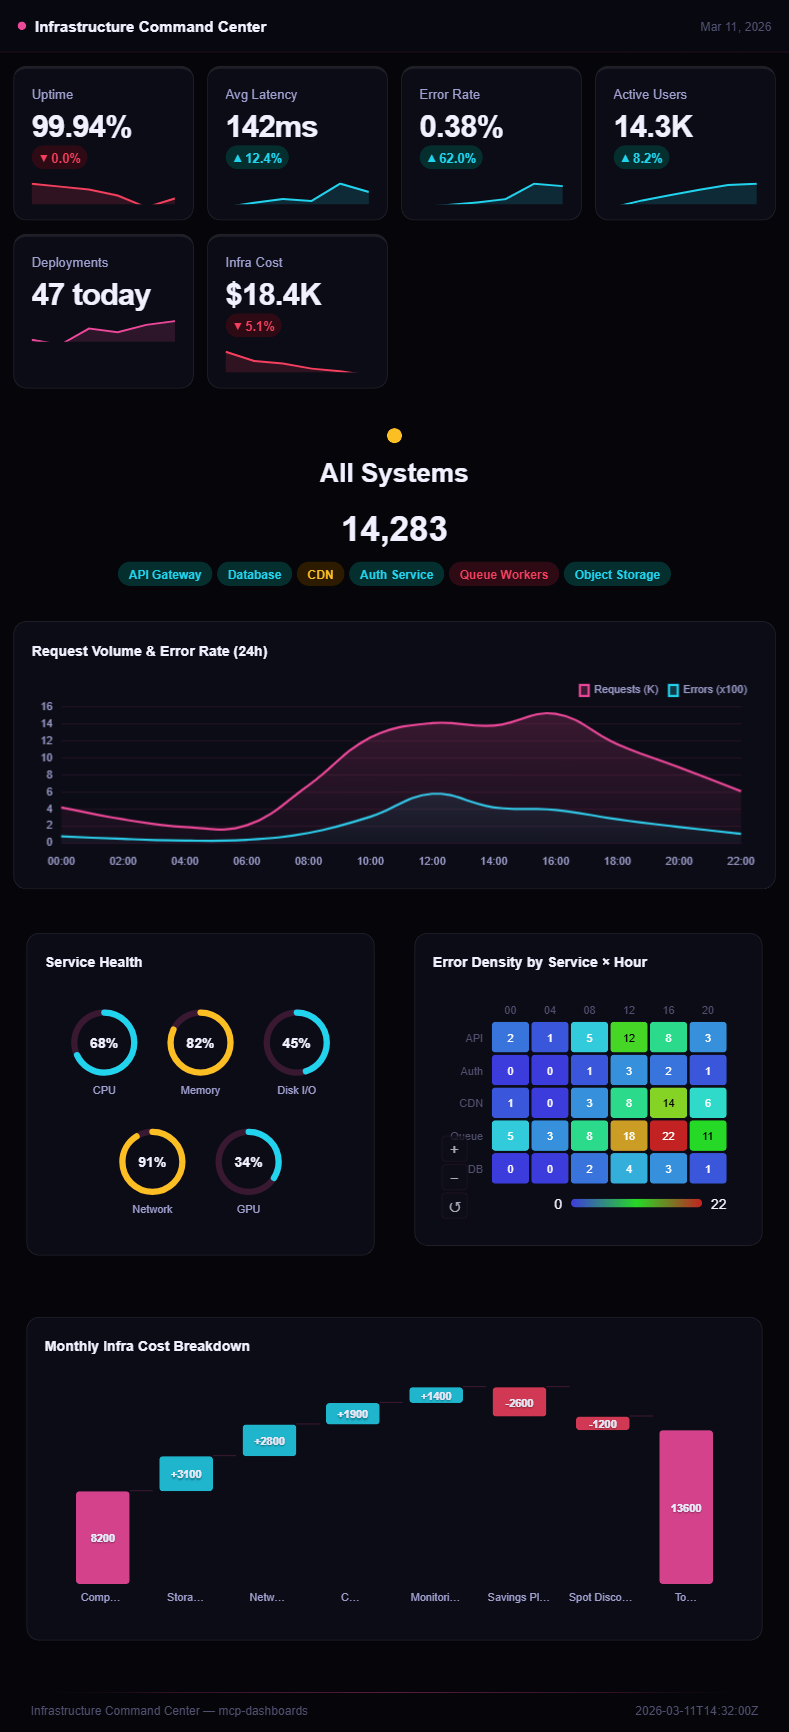
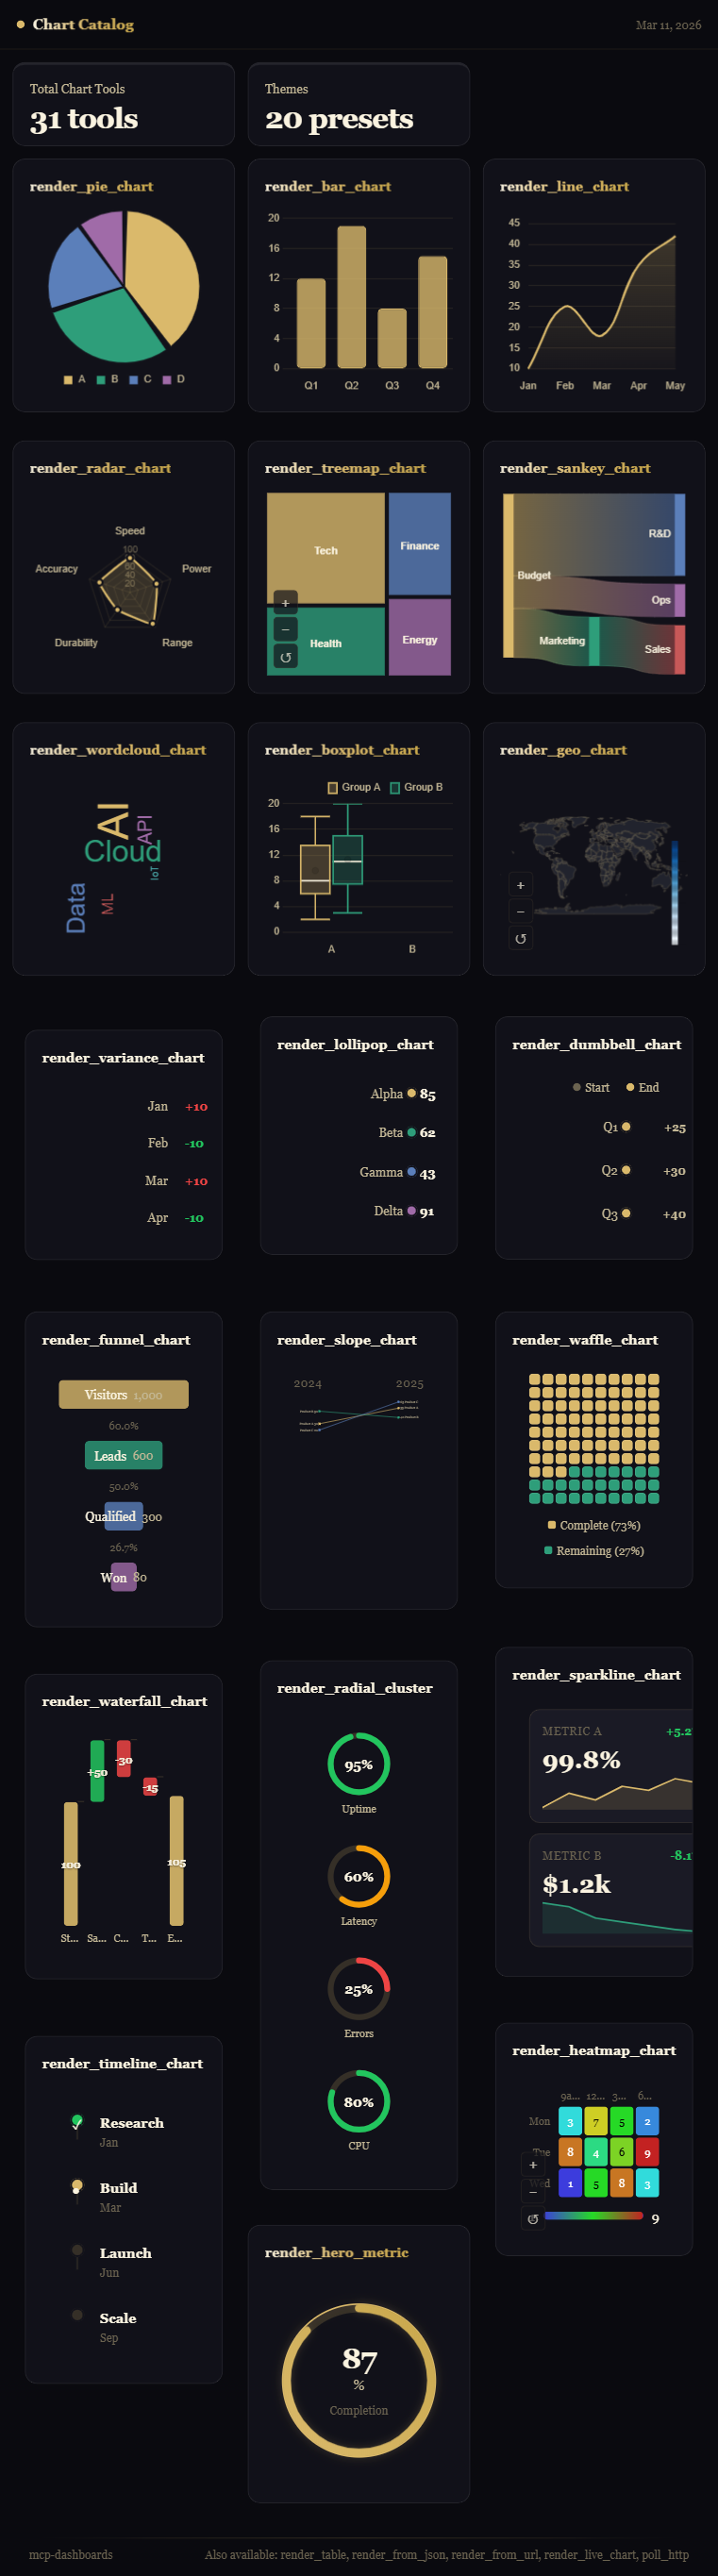
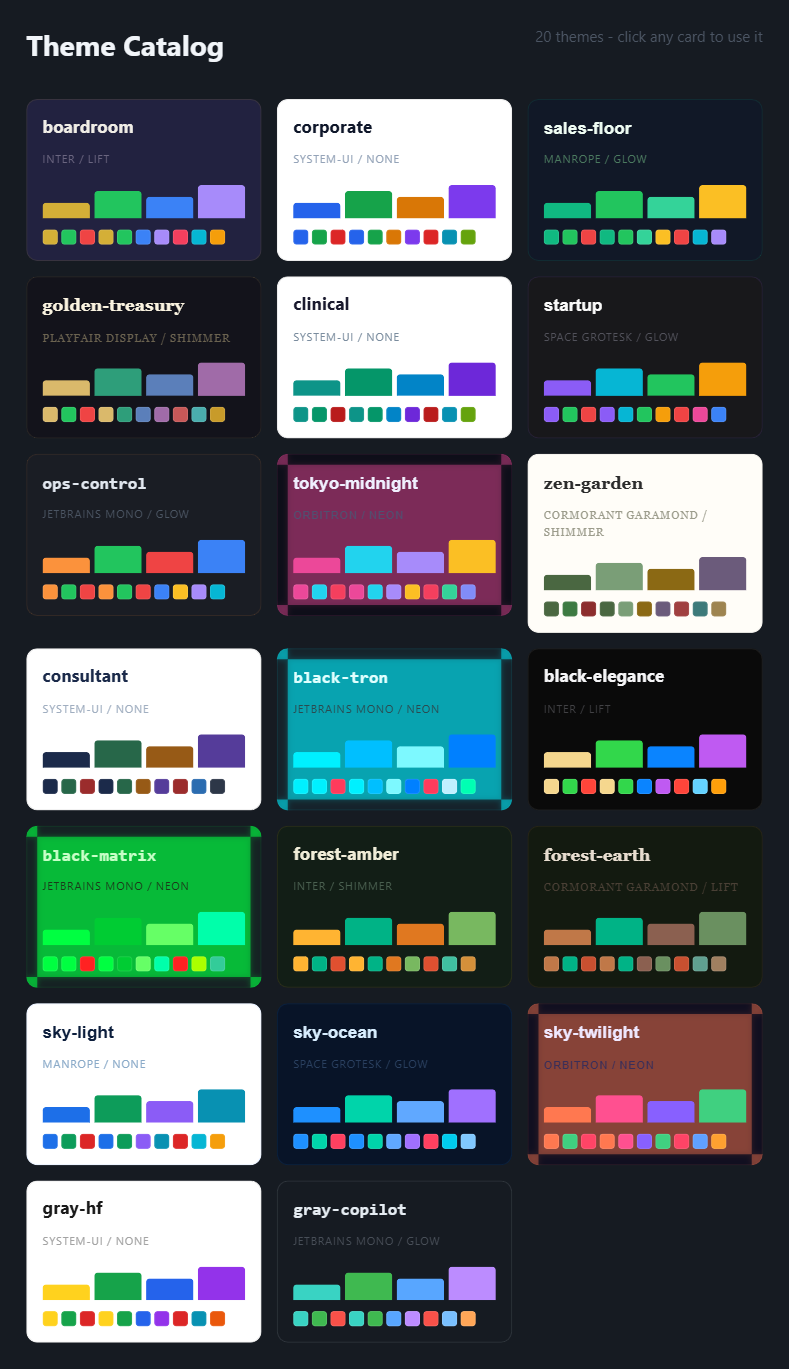
Click any thumbnail to see full size
The problem
We use AI for everything - analysis, reports, strategy. But when it comes to actually seeing the story in your data, you're stuck copying numbers into a spreadsheet and building charts yourself. The conversation has the insight. The visualization is somewhere else.
The solution
MCP Dashboards renders interactive charts, dashboards, and KPI widgets directly inside your AI conversation. 32 chart tools covering 45+ chart subtypes (bar has stacked/drilldown, hero has 11 variants, flowchart has 6 node kinds + 5 edge styles, etc.), 21 themes, 4 visual discovery catalogs, live polling, PNG/PPT/A4 export - all from a single MCP server. No browser tabs, no copy-paste, no context switching.
Works in
| Client | Interactive in-chat rendering | How |
|---|---|---|
| Claude Desktop | Yes (MCP Apps) | stdio config below |
| claude.ai (web) | Yes (MCP Apps) | remote connector |
| ChatGPT | Yes (MCP Apps) | remote server via Developer mode (Settings → Apps → Advanced) |
| VS Code GitHub Copilot | Yes (MCP Apps) | stdio config |
| Goose / Postman / MCPJam | Yes (MCP Apps) | stdio or remote |
| Claude Code (CLI) | Tools + browser preview fallback | claude mcp add below; charts open in a local browser tab |